'%3e%3cpath%20id='stem'%20d='M50,4C51,4%2052.4,5%2052.8,5.8C53,8.5%2052.8,12.5%2052.4,14.8C52.2,15.5%2051.7,15.9%2050.9,15.9L49.2,15.9C48.4,15.9%2047.9,15.5%2047.8,14.8L47.5,6.2C48,5.4%2049,4.4%2050,4Z'%20style='fill:rgb(2,103,193);fill-rule:nonzero;'/%3e%3cpath%20id='leaf'%20d='M55.4,12.5C57.2,11%2062.254,9.359%2065.789,10.737C69.999,12.377%2070.7,15.3%2071.2,16.8C69.8,17.7%2067.4,18%2065,18C61.3,17.8%2058.3,15.5%2055.4,12.5Z'%20style='fill:rgb(2,103,193);fill-rule:nonzero;'/%3e%3cpath%20id='left-flesh'%20d='M50,15.8C46.7,15.6%2043.2,16.2%2040.1,19.3C37.3,21.9%2035.6,27.1%2033.2,32.9C31.8,36.6%2029.7,40%2027,43.6C21.8,50.8%2018.9,59.3%2018.9,66.1L39.9,62.3C40.6,55.5%2048,44%2050,41.3L50,15.8Z'%20style='fill:rgb(239,160,11);fill-rule:nonzero;'/%3e%3cpath%20id='right-flesh'%20d='M50,15.8C53.3,15.6%2056.8,16.2%2059.9,19.3C62.7,21.9%2064.4,27.1%2066.8,32.9C68.2,36.6%2070.3,40%2073,43.6C78.2,50.8%2081.1,59.3%2081.1,66.1C81.1,72.853%2078.902,79.423%2074.838,84.816L57.525,71.138C59.375,68.875%2060.4,65.75%2060.1,62.3C59.4,55.5%2052,44%2050,41.3L50,15.8Z'%20style='fill:rgb(214,81,8);fill-rule:nonzero;'/%3e%3cpath%20id='blue-base'%20d='M18.9,66.1L39.9,62.3C39.3,69.2%2044,74.8%2050,74.8C53,74.8%2055.675,73.4%2057.525,71.138L74.838,84.816C68.961,92.614%2059.764,97.2%2050,97.2C32.824,97.2%2018.9,83.276%2018.9,66.1Z'%20style='fill:rgb(2,103,193);fill-rule:nonzero;'/%3e%3c/g%3e%3c/svg%3e)

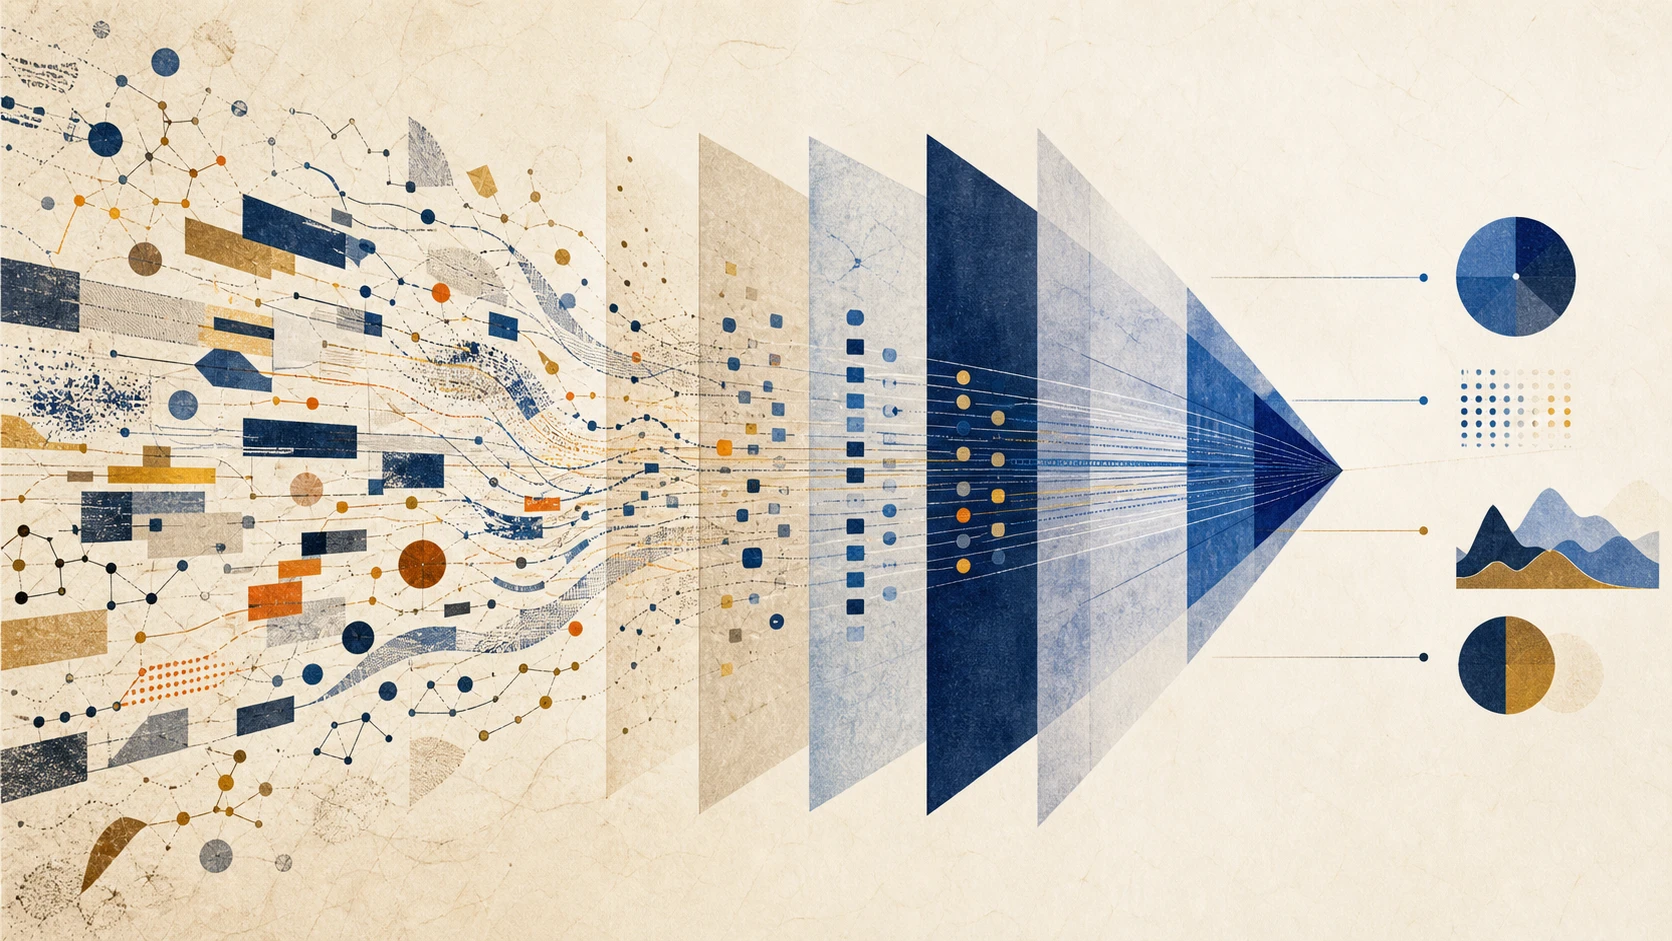
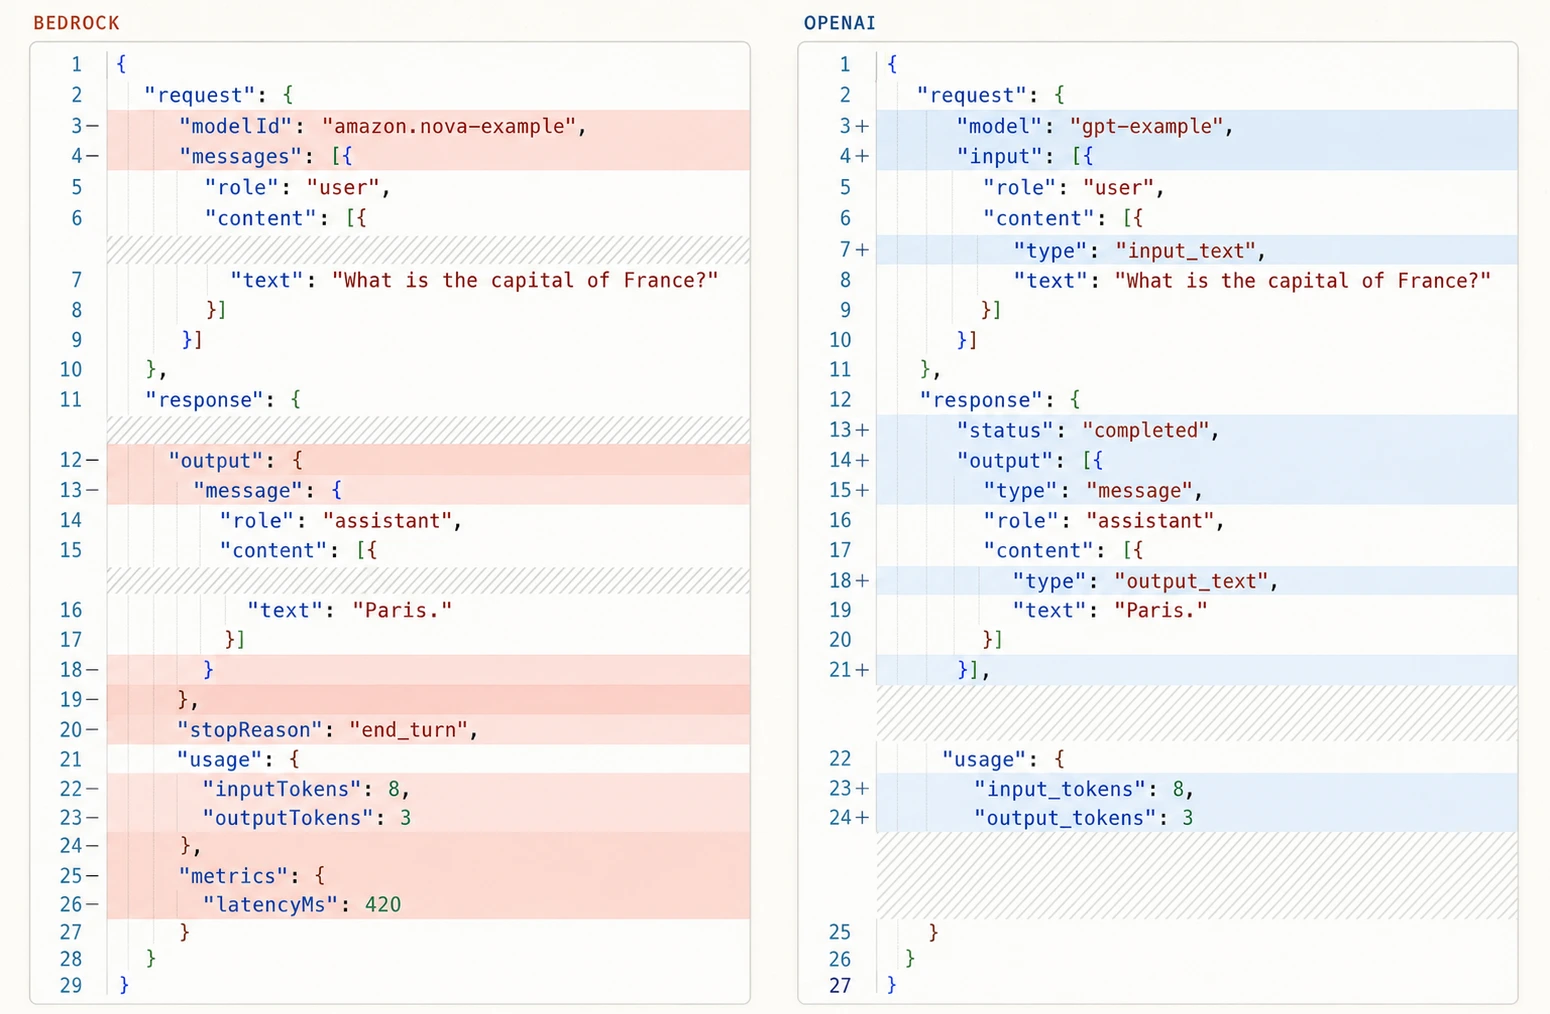
Logs from your agentic applications (aka traces) come in all shapes and sizes these days. Usually they are a list or tree structure of messages (spans) between the app user and a large language model (LLM). It can also be a graph in agent to agent (A2A) situations. Depending on the use cases (e.g., data analytics), there can be hundreds of tool uses, responses, sub-agent threads, etc. in a single session, which can make the traces large JSON blobs. Add various LLM providers and agentic app frameworks to the mix and you get a soup of attributes and nested structures. For example, the JSON shape used by OpenAI does not match the one from Bedrock (see below).
So when you try to make sense of these conversations between humans and AI, correlate that with application transaction or analytical data, to measure business outcomes or AI impact, the structure, volume and quality of these traces become a blocker.
This is where you need to apply data engineering practices to capture the raw traces as is, normalize/canonicalize to an inclusive data model or structure that can hold all types of agentic traces, dedupe and transform from raw to canonical form, aggregate them for analytical inspections, enrich them for correlation with existing analytical datasets, connect them from aggregates to raw for lineage evidence, and finally apply retentions and redactions for compliance. In short, instrumentation makes agent behavior visible; data engineering makes it understandable at scale.
Why agent traces are difficult data
Heterogeneous
As shown in the picture above, SDKs, providers, and frameworks use different structures and names for similar concepts. A model interaction may appear as a span, generation, observation, event, or nested record.
Hierarchical
One workflow may include agent runs, model calls, tool operations, retrieval, parallel branches, nested agents, retries, and fallbacks. Flattening can destroy the execution structure; retaining arbitrary JSON makes consistent analysis difficult.
Distributed and incomplete
Events may arrive independently, out of order, more than once, or without a clean terminal event. Usage information and business outcomes may arrive separately from execution events. You may be inclined to sort them based on the event timestamp, but that might break the lineage.
Ambiguous in identity
What represents one workflow: a request, root span, conversation, agent run, or resumed execution? Reliable analysis depends on stable identities and explicit relationships.
Constantly evolving
Replacing a model, adding a tool, or changing orchestration can alter trace shape without changing the application's business purpose. The analytical model must remain useful across those changes.
Sensitive and potentially large
Prompts, responses, retrieved documents, and tool results can contain sensitive or high-volume payloads. Not everything captured belongs in every product or analytical table.
The AI observability data pipeline
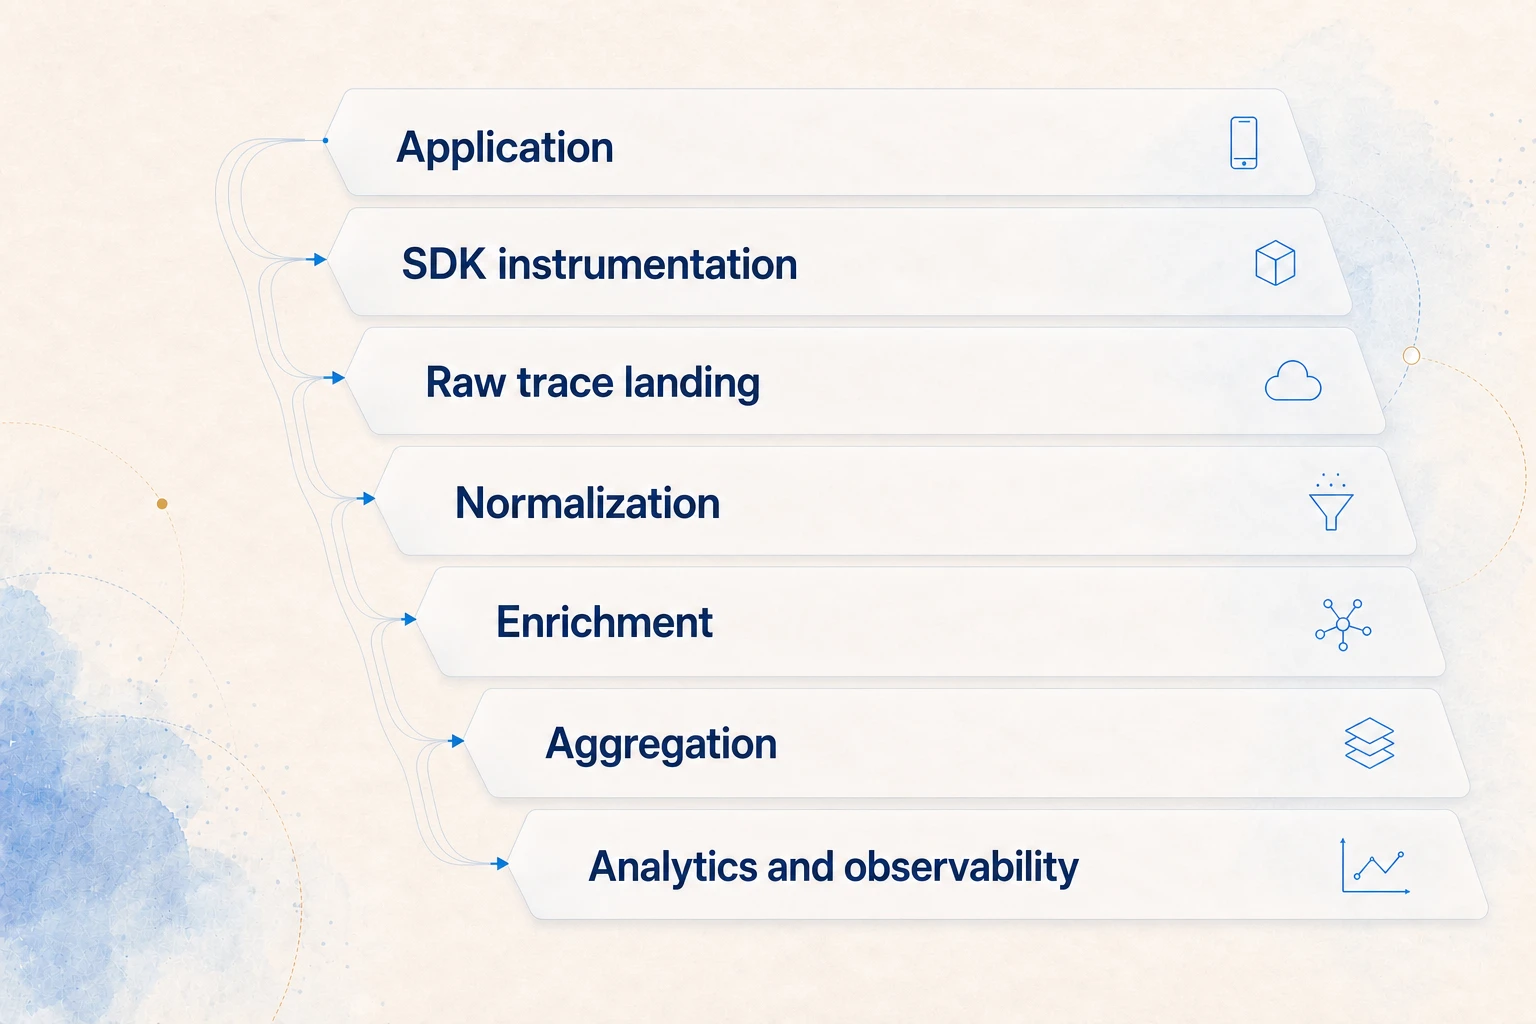
Capture
Capturing traces is the very first step and it is often in the form of an SDK wrapper for popular LLM SDKs. Typically you have to replace your OpenAI, Anthropic or other LLM agentic SDKs with the corresponding wrapper from an observability provider, or use an agentic orchestrator framework and use that to capture and store traces, or you can write your own wrapper if you are building the capability in-house.
During the capture, you should think about all the attributes you need at minimum to answer your immediate visibility questions and near future business questions. This will range from basic message arrays with timestamps, messages and types, to spans with parent-child relationships, tool use attributes, model details, token/cost metadata, environment/workflow/app details, status, feedback, etc. You could do some transformation at this step itself but it is highly discouraged for reasons like distribution complexity, compute ownership, reprocessability, etc.
Store
Landing and storing the raw traces is the next step. The first priority here is to store everything as is, avoid dropped traces using queues or other such mechanisms, and store it in a format and organizational structure that simplifies ingestion to the next normalization phase, as well as evidence drill downs from metrics dashboards to a granular trace. JSON or parquet files per session, with folder partitions for date and hour, are a decent place to start. You will need some authentication if you are processing traces at a remote location, but it’s better to capture unauthenticated traces as well, in a separate bucket with low retention, to counter token expiry mishaps. Yes, they may get polluted by spam but that’s a minor concern if any.
Normalize
As the traces are stored in S3/GCS or similar cloud storage, you can trigger an event-driven processor to start the normalization functions. It is important to decouple the workflow here to avoid ingestion bottlenecks as the normalization process may demand more compute steps and execution time. Normalization mainly includes identifying and transforming the incoming shape and attributes to a standard data model for traces. This model should be inclusive of all attributes you can expect from different AI providers.
A typical example is thinking tokens. Not all models provide this capability and hence may not have spans for thinking time in the trace, or even usage metadata for thinking tokens. But as some models support that, and you might want to measure the impact of “thinking”, you need to make accommodations for storing that in the trace data model, and transform incoming attribute values to the right places and types in the model.
This transformation process can employ adapters built per LLM model version, or heuristics in other cases (if you find x under y, store it as z). If both adapters and heuristic rules fail to map a shape or attribute in a trace, you can employ a cheaper/faster LLM model to attempt a dynamic mapping, turning that into a new heuristic rule, with a human in the loop review. Ideally you want to mark such traces for review and process them in batches later, so that you can apply the same rule to all matching shapes in one go rather than making an LLM call per trace. Processed normalized traces are then stored separately from raw, with longer retention and access controls.
You may employ redaction of sensitive information anywhere from the SDK wrapper stage to storage or normalization but it is recommended to do that as early as possible to reduce exposure. Sometimes in multiple stages to defend against schema drift in the application layer or just to provide additional safety nets.
Data model
The very first question people face when storing the normalized traces in relational database tables is about granularity. It makes sense to keep just a traces table if you are only interested in session/request level analytics but if you want to dive into tool use, you should store at span level. Maybe store one row per span in a spans table and one row per trace in a traces table. This is the starting point for the model but then you can go further, creating tables per different type of tool use, artifacts, etc. OSS tools like Langfuse are already planning for denormalized span tables where you repeat trace attributes.
You can also store spans as nested structures in the traces table itself, but your database might not make it easy to unpack the shape and perform analysis inside those nested attributes at query time, usually. These days you should optimize for what form of SQL/HQL/GQL your LLM is an expert on, and pick the data model accordingly. But a simple relational table with flattened attributes usually wins on query generation, performance and storage costs.
Enrich
Beyond the basic tables to store normalized traces, you will need enrichments (e.g., mapping from user-id in traces to customer-id in your dimensional model), and then aggregates to improve query performance if you are planning for dashboards that show a dozen cards on a page.
Enrichment is essential to map the AI apps and their business performance with your regular business metrics. For instance you might want to do segmentation analysis on your customers from agentic apps, or you want to measure the ROI on tokens spent for addressing customer grievances vs hours paid on phone support. The idea is to keep it minimal to enrich the traces with basic attributes for identifying customers, products, transactions, etc. and then make it easy to perform a JOIN later. Ideally the app should inject this as metadata or should be structured enough to parse them out (e.g., from tool call parameters).
There are many other forms of enrichments as well; for instance, the parent-child relations (trace tree) are usually not SQL-friendly (recursive CTEs) to chain together at query time, and if you want metrics related to that DAG, you should capture them at ETL time itself as an enrichment. Calculating group identity, duration/cost derivation, workflow classification, etc. are a few other examples to tackle as enrichments.
Aggregate
For typical observability dashboards, you might want to show performance trends, percentile bucketing, top movers, etc. on token usage, $ per success, tool error rate and many more metrics. Running these queries on larger time frames every time is not a good idea from a performance or cost angle. You should move those queries to an ETL and store the aggregates as tables and refresh them periodically.
Since the trace data is chronological in nature, you can employ a micro-batch that runs, say, every 10 minutes or so to process and update the aggregates to hourly grain and then daily, monthly, etc. It is better not to stray too far away from relational models for aggregates, if you are planning to use LLMs for answering questions about these traces.
It is wise to throw a cache layer on top of these aggregates, to serve the dashboards and keep the costs on the database side to a minimum. You can cache the query results on first run or as a warmup process and expire them based on your aggregate update frequency or detecting which windows became stale (proactive caching).
I am skipping canonicalization deliberately as I believe it deserves its own post. But we will need a canonicalization step after normalization and that also might need some ETL processes and maybe a separate data model on top of the normalized one. This is where we will define what is the source of truth, or ideal shape for traces, as defined or demanded by business processes. A canonical model should make different agents comparable without pretending they are identical.
We should pay attention to preserving the lineage from aggregates to raw traces as we build these datasets. The layers should remain connected:
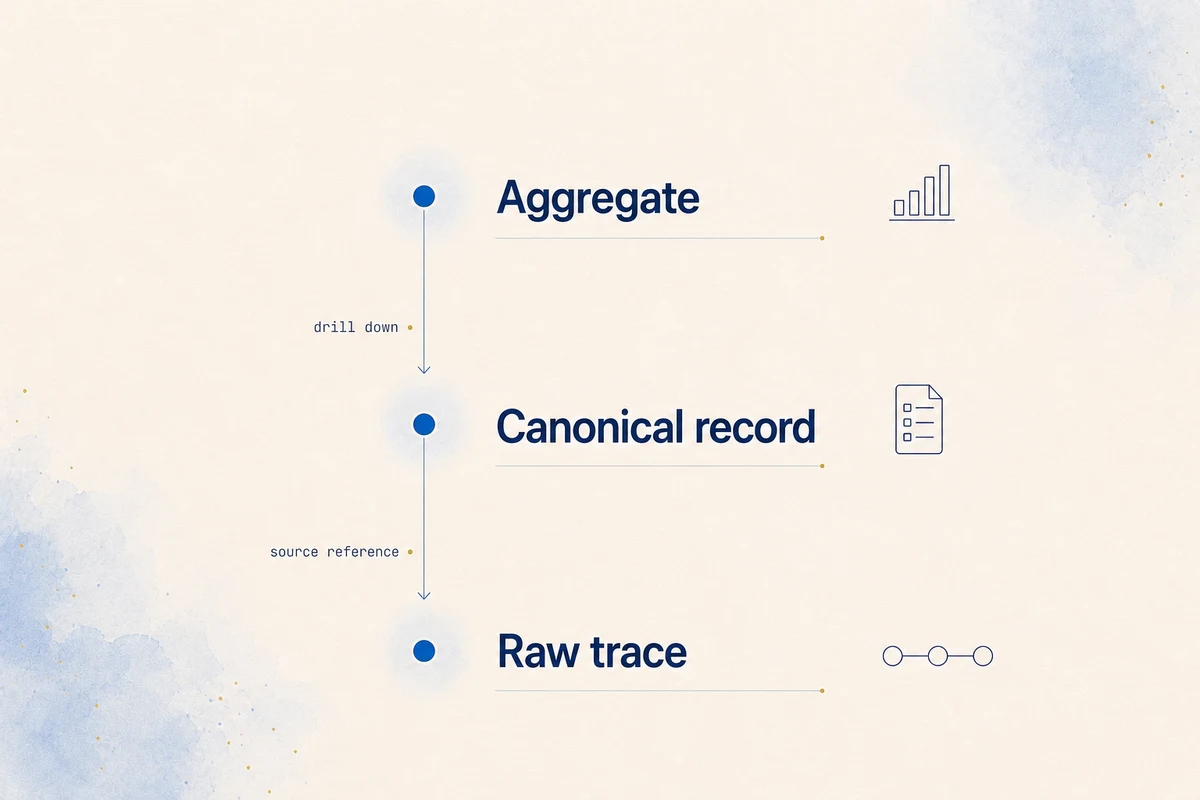
In a nutshell, raw traces provide evidence, canonical data provides meaning and aggregates provide speed.
Where Papaya fits
Papaya starts where a conventional observability dashboard stops. It brings in traces from the Papaya SDK, offline archives, and formats such as Langfuse, LangSmith, Braintrust, and LangChain, then makes those different structures comparable without losing the path back to raw evidence.
Papaya analyzes repeated production runs for tool failures, loops, context gaps, redundant calls, and cost or latency waste. The result is a ranked list of Improvements, with a drill-down from the recommendation to the exact trace, message, tool call, and model usage that supports it. In terms of this article, Papaya uses the pipeline to turn evidence into a change worth making—not just another chart to interpret. See how it works.
What next?
Once the data foundation is built, the next questions are:
- What metrics describe agentic performance effectiveness (success rate, cost, latency), and what do people care about today and in six months?
- What perspectives help to understand this information better (trends, buckets, rankings, correlations, etc.), by what dimensions (time, model, tool, workflow, etc.)?
- What is the bar for data quality and freshness?
- How to evolve the metrics and canonical models with the changes from the LLM side?
- What to do with the findings, how to fix problems in agentic workflows, and how to iterate?
I will address these questions in follow-up posts. But for now I hope I have made the case for why we should treat observability as a data engineering problem and the basics you should get right on day 1. I will be sharing the data models I described here, the pipelines to build them, SDK wrapper examples, dashboards, etc. as OSS as part of this series. Stay tuned, and join our Discord channel if you have questions.
Related
Keep reading
Agent evaluation
How to Evaluate AI Agents in Production: A Practical Framework
In one public benchmark we analyzed, 22% of runs confidently told the customer the job was done without ever calling the real API. A guide to evaluating agents beyond the pass rate.
Article
Agent Optimization vs. Observability: Why Watching Isn't Fixing
Your dashboard saw the bad run and did nothing. The gap isn't between having data and not — it's between seeing what happened and knowing what to change.